Gold is on the cusp of a major breakout from its super-bullish cup and handle pattern. The measured upside target is $3000/oz, and the log target is roughly $4000/oz.
These targets may sound extreme, but breakouts from multi-decade bases are rare but very bullish. Furthermore, a breakout from a long-term base to a new all-time high is also very bullish.
Think of how the stock market performed after 1982 or how gold stocks performed after breaking 25-year resistance in 1964. The breakout is not only very bullish in an immediate sense (think of a two to three-year time frame) but also is over the next decade.
These types of moves do not occur in a vacuum. They are accompanied by major market shifts and capital flows from one asset or market to another.
The coming breakout and new secular bull market in gold and precious metals will coincide with new secular bear markets in both the US stock market and the US Bond market. Capital is rotating out of financial assets, which will accelerate after gold’s breakout.
With that said, let me zoom in on the present.
A few weeks ago, I wrote about the importance of gold’s monthly and quarterly close, $1950 resistance, and gold’s performance against the stock market and foreign currencies.
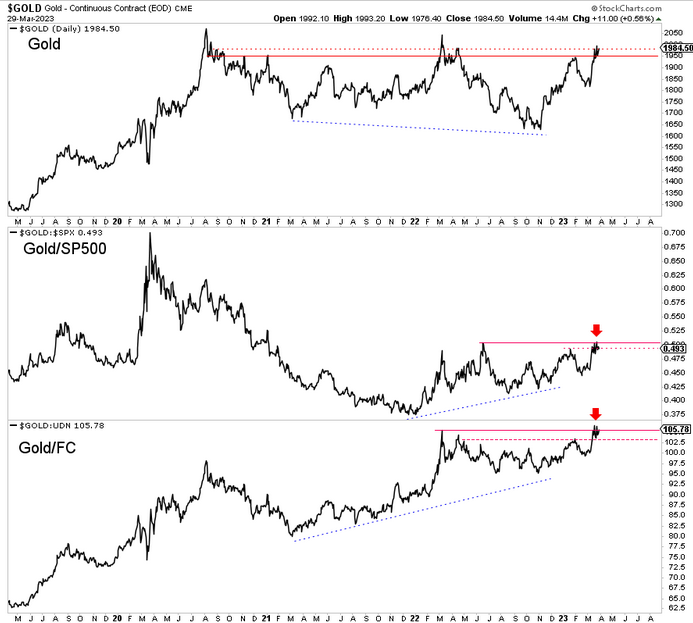
As you can see in the daily chart below, gold is battling resistance at $1985, gold against foreign currencies is battling its all-time high, and gold against the stock market is battling its 2-year high.
Any push higher above the resistance could spark another leg to the upside and a new all-time high in gold.

On the other hand, the bears could make a last stand here and prevent gold from breaking out. But that would be temporary.
In any case, with gold so close to a historic breakout, the larger risk is being out of the market. You need to be invested before gold blows through $2100, carries silver to $30 again, and is much higher.
If gold cannot break $2100 in the next month or two, consider it an incredible last-chance opportunity to buy.


